
pyrato.edc#
Sub-module implementing different methods for the calculation of energy decay curves (EDCs) from measured or simulated room impulse responses (RIRs).
Functions:
|
Schroeder integration with prior subtraction of average noise power. |
|
Combination of Chu's and Lundeby's methods. |
|
Truncated Schroeder integration with additive truncation compensation. |
|
Truncated Schroeder integration. |
|
Calculate the intersection time between impulse response and noise. |
|
Calculate the Schroeder integral of a room impulse response. |
|
Subtract the noise power from a squared room impulse response. |
Threshold an energy decay curve. |
- pyrato.edc.energy_decay_curve_chu(data, noise_level='auto', is_energy=False, time_shift=True, channel_independent=False, normalize=True, threshold=10, plot=False)[source]#
Schroeder integration with prior subtraction of average noise power.
Chu [1] proposed to subtract the average power of the additive measurement noise from the energy impulse response prior to applying the Schroeder integral. The noise power $N_{est}$ is estimated from the last 10 percent of the room impulse response if not given by the user.
\[E(t) = \int_t^{t_{IR}} (h^2(\tau) - N_{est}) d\tau\]- Parameters:
data (pyfar.Signal) – The room impulse response
noise_level (ndarray, float or string) – If set to ‘auto’, the noise power is calculated based on the last 10 percent of the RIR. Otherwise it needs to be given for each individual channel of the input. The default is ‘auto’.
is_energy (boolean) – If True the input data is proportional to energy density; if False the input data is proportional to sound pressure.
time_shift (bool) – If True, the delay of the RIR is removed.
channel_independent (boolean) – Defines, if the time shift and normalization is done channel-independently or not.
normalize (bool) – If True, the energy decay curve is normalized.
threshold (float, None) – Defines a peak-signal-to-noise ratio based threshold in dB for final truncation of the EDC. Values below the sum of the threshold level and the peak-signal-to-noise ratio in dB are discarded. The default is 10 dB. If None, the decay curve will not be truncated further.
plot (Boolean) – Specifies, whether the results should be visualized or not.
- Returns:
Returns the noise compensated edc.
- Return type:
References
Examples
>>> import numpy as np
>>> import pyfar as pf
>>> import pyrato as ra
>>> from pyrato.analytic import rectangular_room_rigid_walls
...
>>> L = np.array([8, 5, 3])/10
>>> source_pos = np.array([5, 3, 1.2])/10
>>> receiver_pos = np.array([1, 1, 1.2])/10
>>> rir, _ = rectangular_room_rigid_walls(
...     L, source_pos, receiver_pos,
...     reverberation_time=1, max_freq=1e3, n_samples=2**16,
...     speed_of_sound=343.9)
...
>>> awgn = pf.signals.noise(
...     rir.n_samples, rms=rir.time.max()*10**(-40/20),
...     sampling_rate=rir.sampling_rate)
>>> rir = rir + awgn
>>> edc = ra.edc.energy_decay_curve_chu(rir)
...
>>> pf.plot.time(rir/np.abs(rir.time).max(), dB=True, label='RIR')
>>> ax = pf.plot.time(
...     edc/edc.time[..., 0], dB=True, log_prefix=10, label='EDC')
>>> ax.set_ylim(-65, 5)
>>> ax.legend()
(
Source code,png,hires.png,pdf)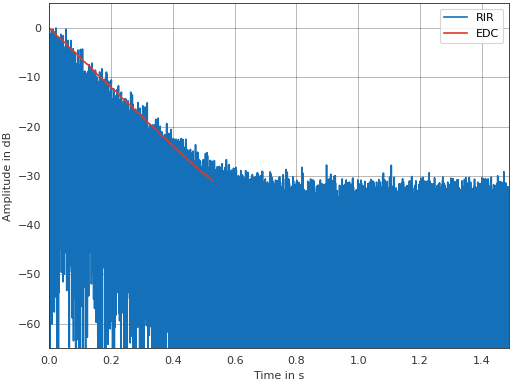
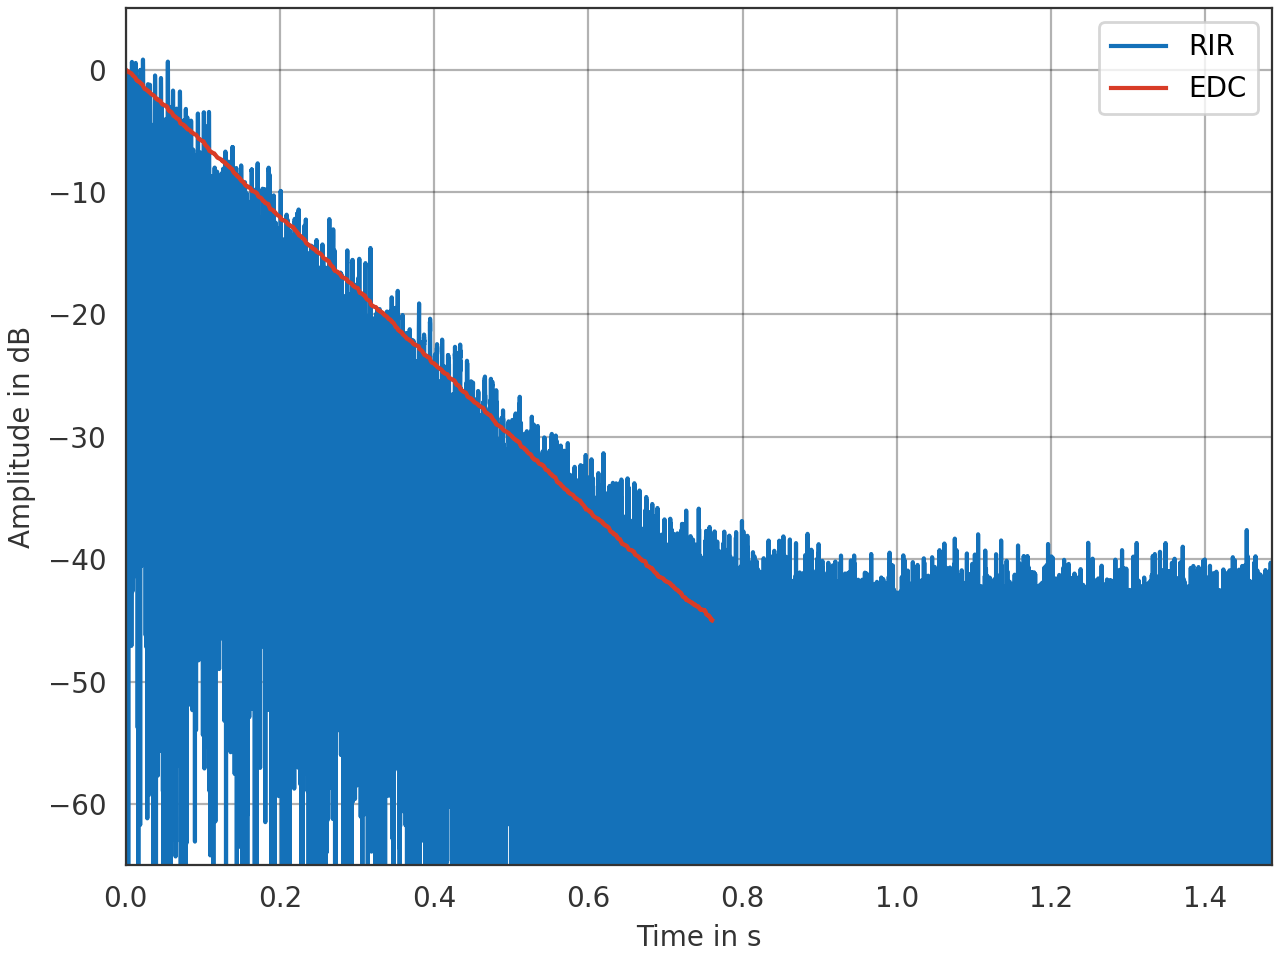
- pyrato.edc.energy_decay_curve_chu_lundeby(data, freq='broadband', noise_level='auto', is_energy=False, time_shift=True, channel_independent=False, normalize=True, plot=False)[source]#
Combination of Chu’s and Lundeby’s methods.
The average power $N_{set}$ of the additive measurement noise is subtracted from the energy impulse response prior to applying the Schroeder integral. The Schroeder integration is truncated at the intersection with the noise floor and the truncation error compensated based on the assumption of a single exponential late decay process. For a more detailed description of the method, see [2].
\[ \begin{align}\begin{aligned}E_(t) = \int_t^{t_i} (h^2(\tau) - N_{est}) d\tau + C\\C = p_{i}^2 \cdot T_\mathrm{late} \cdot \frac{1}{6 \cdot ln(10)}\end{aligned}\end{align} \]Note
The EDC contains
np.nanvalues if the intersection time could not be computed due to a low signal-to-noise ration. In this case a warning is raised as well.- Parameters:
data (pyfar.Signal) – The room impulse response.
freq (integer OR string) – The frequency band. If set to ‘broadband’, the time window of the Lundeby-algorithm will not be set in dependence of frequency.
noise_level (ndarray, double OR string) – If not specified, the noise level is calculated based on the last 10 percent of the RIR. Otherwise specify manually for each channel as array.
is_energy (boolean) – If True the input data is proportional to energy density; if False the input data is proportional to sound pressure.
time_shift (boolean) – Defines, if the silence at beginning of the RIR should be removed.
channel_independent (boolean) – Defines, if the time shift and normalization is done channel-independently or not.
normalize (boolean) – Defines, if the energy decay curve should be normalized in the end or not.
plot (Boolean) – Specifies, whether the results should be visualized or not.
- Returns:
Returns the noise compensated edc.
- Return type:
References
Examples
Calculate and plot the EDC using a combination of Chu’s and Lundeby’s methods.
>>> import numpy as np
>>> import pyfar as pf
>>> import pyrato as ra
>>> from pyrato.analytic import rectangular_room_rigid_walls
...
>>> L = np.array([8, 5, 3])/10
>>> source_pos = np.array([5, 3, 1.2])/10
>>> receiver_pos = np.array([1, 1, 1.2])/10
>>> rir, _ = rectangular_room_rigid_walls(
...     L, source_pos, receiver_pos,
...     reverberation_time=1, max_freq=1e3, n_samples=2**16,
...     speed_of_sound=343.9)
>>> rir = rir/rir.time.max()
...
>>> awgn = pf.signals.noise(
...     rir.n_samples, rms=rir.time.max()*10**(-50/20),
...     sampling_rate=rir.sampling_rate)
>>> rir = rir + awgn
>>> edc = ra.edc.energy_decay_curve_chu_lundeby(rir)
...
>>> ax = pf.plot.time(rir, dB=True, label='RIR')
>>> pf.plot.time(edc, dB=True, log_prefix=10, label='EDC')
>>> ax.set_ylim(-65, 5)
>>> ax.legend()
(
Source code,png,hires.png,pdf)
- pyrato.edc.energy_decay_curve_lundeby(data, freq='broadband', noise_level='auto', is_energy=False, time_shift=True, channel_independent=False, normalize=True, plot=False)[source]#
Truncated Schroeder integration with additive truncation compensation.
Lundeby et al. [3] proposed a correction term to for the truncation error. The missing signal energy, caused by limiting the integration time, is estimated under the assumption of a single exponential late decay process.
\[ \begin{align}\begin{aligned}E(t) = \int_t^{t_i} h^2(\tau) d\tau + C\\C = p_{i}^2 \cdot T_\mathrm{late} \cdot \frac{1}{6 \cdot ln(10)}\end{aligned}\end{align} \]Note
The EDC contains
np.nanvalues if the intersection time could not be computed due to a low signal-to-noise ration. In this case a warning is raised as well.- Parameters:
data (pyfar.Signal) – The room impulse response.
freq (integer OR string) – The frequency band. If set to ‘broadband’, the time window of the Lundeby-algorithm will not be set in dependence of frequency.
noise_level (ndarray, double OR string) – If not specified, the noise level is calculated based on the last 10 percent of the RIR. Otherwise specify manually for each channel as array.
is_energy (boolean) – If True the input data is proportional to energy density; if False the input data is proportional to sound pressure.
time_shift (bool) – If True, the delay of the RIR is removed.
channel_independent (boolean) – Defines, if the time shift and normalizsation is done channel-independently or not.
normalize (boolean) – Defines, if the energy decay curve should be normalized in the end or not.
plot (Boolean) – Specifies, whether the results should be visualized or not.
- Returns:
Returns the noise compensated energy decay curve.
- Return type:
References
Examples
Plot the room impulse response and the energy decay curve calculated after Lundeby.
>>> import numpy as np
>>> import pyfar as pf
>>> import pyrato as ra
>>> from pyrato.analytic import rectangular_room_rigid_walls
...
>>> L = np.array([8, 5, 3])/10
>>> source_pos = np.array([5, 3, 1.2])/10
>>> receiver_pos = np.array([1, 1, 1.2])/10
>>> rir, _ = rectangular_room_rigid_walls(
...     L, source_pos, receiver_pos,
...     reverberation_time=1, max_freq=1e3, n_samples=2**16,
...     speed_of_sound=343.9)
>>> rir = rir/rir.time.max()
...
>>> awgn = pf.signals.noise(
...     rir.n_samples, rms=rir.time.max()*10**(-50/20),
...     sampling_rate=rir.sampling_rate)
>>> rir = rir + awgn
>>> edc = ra.edc.energy_decay_curve_lundeby(rir)
...
>>> ax = pf.plot.time(rir, dB=True, label='RIR')
>>> pf.plot.time(edc, dB=True, log_prefix=10, label='EDC')
>>> ax.set_ylim(-65, 5)
>>> ax.legend()
(
Source code,png,hires.png,pdf)
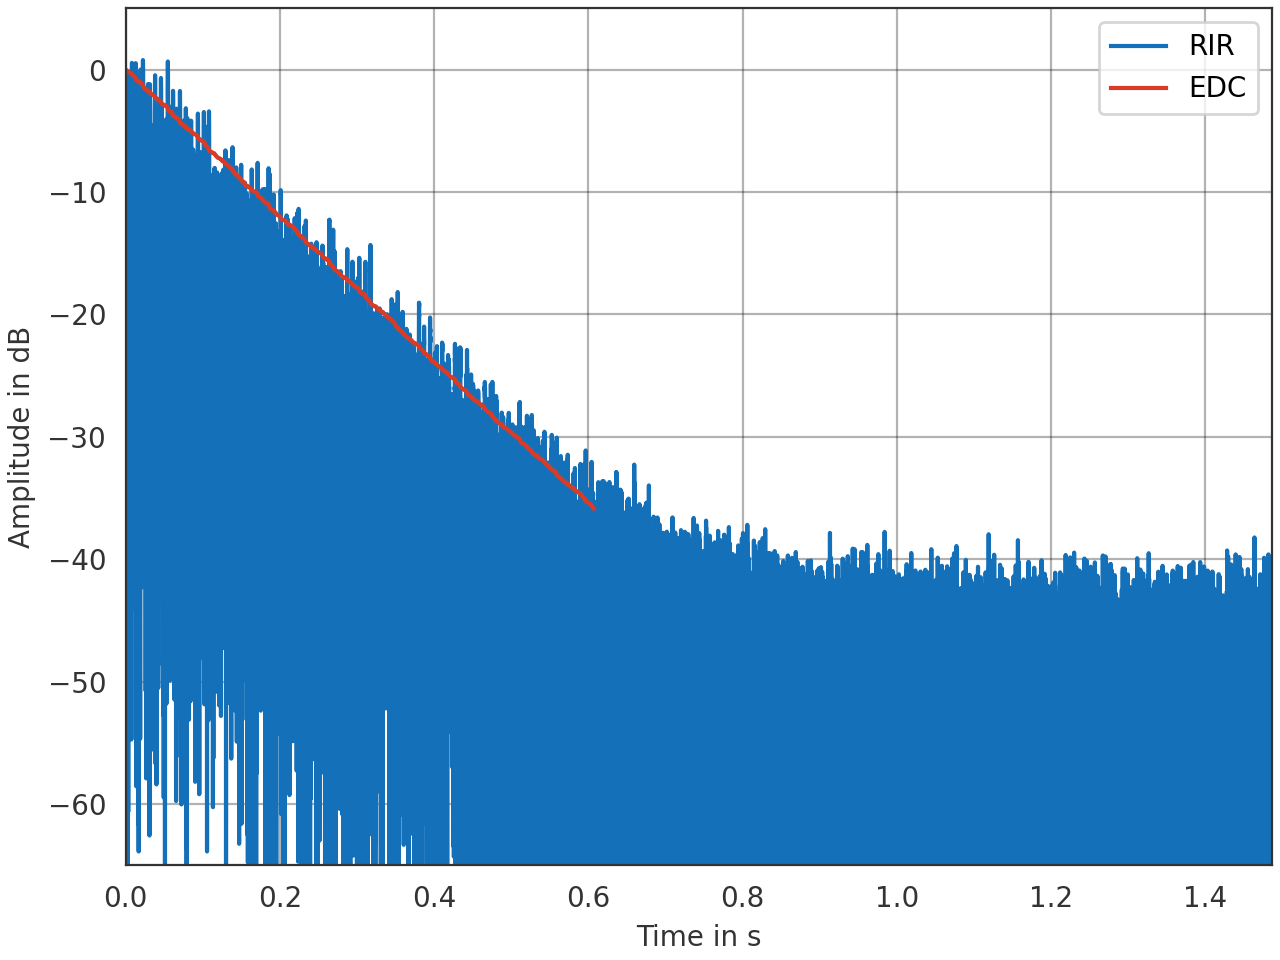
- pyrato.edc.energy_decay_curve_truncation(data, freq='broadband', noise_level='auto', is_energy=False, time_shift=True, channel_independent=False, normalize=True, threshold=15, plot=False)[source]#
Truncated Schroeder integration.
The integration is truncated at the intersection with measurement noise, which is estimated from the room impulse response using Lundeby’s algorithm. An initial estimation of the noise power is performed on the last 10 percent of the impulse response, if no value is passed. Using the default parameters, the function is compliant with ISO 3382-1:2009 [4].
\[E_(t) = \int_t^{t_{i}} h^2(\tau) d\tau\]Note
The EDC contains
np.nanvalues if the intersection time could not be computed due to a low signal-to-noise ration. In this case a warning is raised as well.- Parameters:
data (pyfar.Signal) – The room impulse response.
freq (integer OR string) – The frequency band. If set to ‘broadband’, the time window of the Lundeby-algorithm will not be set in dependence of frequency.
noise_level (ndarray, double OR string) – If not specified, the noise level is calculated based on the last 10 percent of the RIR. Otherwise specify manually for each channel as array.
is_energy (boolean) – If True the input data is proportional to energy density; if False the input data is proportional to sound pressure.
time_shift (boolean) – Defines, if the silence at beginning of the RIR should be removed.
channel_independent (boolean) – Defines, if the time shift and normalization is done channel-independently or not.
normalize (boolean) – Defines, if the energy decay curve should be normalized in the end or not.
threshold (float) – Defines a peak-signal-to-noise ratio based threshold in dB for final truncation of the EDC. Values below the sum of the threshold level and the peak-signal-to-noise ratio in dB are discarded. The default is 15 dB, which is in correspondence with ISO 3382-1:2009.
plot (Boolean) – Specifies, whether the results should be visualized or not.
- Returns:
Returns the noise compensated EDC.
- Return type:
References
Examples
Plot the RIR and the EDC calculated truncating the integration at the intersection time.
>>> import numpy as np
>>> import pyfar as pf
>>> import pyrato as ra
>>> from pyrato.analytic import rectangular_room_rigid_walls
...
>>> L = np.array([8, 5, 3])/10
>>> source_pos = np.array([5, 3, 1.2])/10
>>> receiver_pos = np.array([1, 1, 1.2])/10
>>> rir, _ = rectangular_room_rigid_walls(
...     L, source_pos, receiver_pos,
...     reverberation_time=1, max_freq=1e3, n_samples=2**16,
...     speed_of_sound=343.9)
>>> rir = rir/rir.time.max()
...
>>> awgn = pf.signals.noise(
...     rir.n_samples, rms=rir.time.max()*10**(-50/20),
...     sampling_rate=rir.sampling_rate)
>>> rir = rir + awgn
>>> edc = ra.edc.energy_decay_curve_truncation(rir)
...
>>> ax = pf.plot.time(rir, dB=True, label='RIR')
>>> pf.plot.time(edc, dB=True, log_prefix=10, label='EDC')
>>> ax.set_ylim(-65, 5)
>>> ax.legend()
(
Source code,png,hires.png,pdf)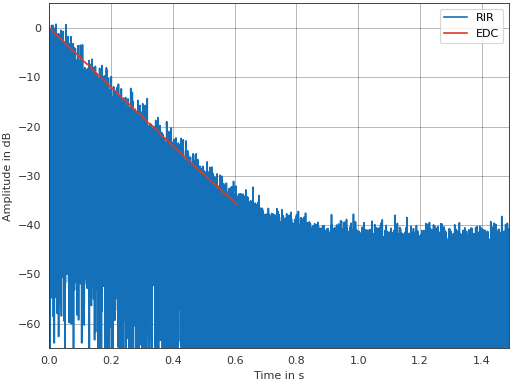
- pyrato.edc.intersection_time_lundeby(data, freq='broadband', initial_noise_power='auto', is_energy=False, time_shift=False, channel_independent=False, plot=False, failure_policy='error')[source]#
Calculate the intersection time between impulse response and noise.
This function uses the algorithm after Lundeby et al. [5] to calculate the intersection time, lundeby reverberation time, and noise level estimation.
- Parameters:
data (pyfar.Signal) – The room impulse response
freq (integer OR string) – The frequency band. If set to ‘broadband’, the time window of the Lundeby-algorithm will not be set in dependence of frequency.
initial_noise_power (ndarray, double OR string) – If
'auto', the noise level is calculated based on the last 10 percent of the RIR. Otherwise specify manually for each channel as array.is_energy (boolean) – If True the input data is proportional to energy density; if False the input data is proportional to sound pressure.
time_shift (boolean) – Defines, if the silence at beginning of the RIR should be removed.
channel_independent (boolean) – Defines, if the time shift and normalization is done channel-independently or not.
plot (Boolean) – Specifies, whether the results should be visualized or not.
failure_policy (string, optional) –
Specifies how failures in detecting the Lundby parameters (see return values below) are handled.
'error': raises an error and the computation is terminated.'warning': raises a warning and returns NaN values. This is useful when computing parameters for multi-channel input, e.g., in octave bands.
The default is
'error'.
- Returns:
intersection_time (ndarray, float) – Returns the Lundeby intersection time for each channel.
reverberation_time (ndarray, float) – Returns the Lundeby reverberation time for each channel.
noise_level (ndarray, float) – Returns the noise level estimation for each channel.
References
Examples
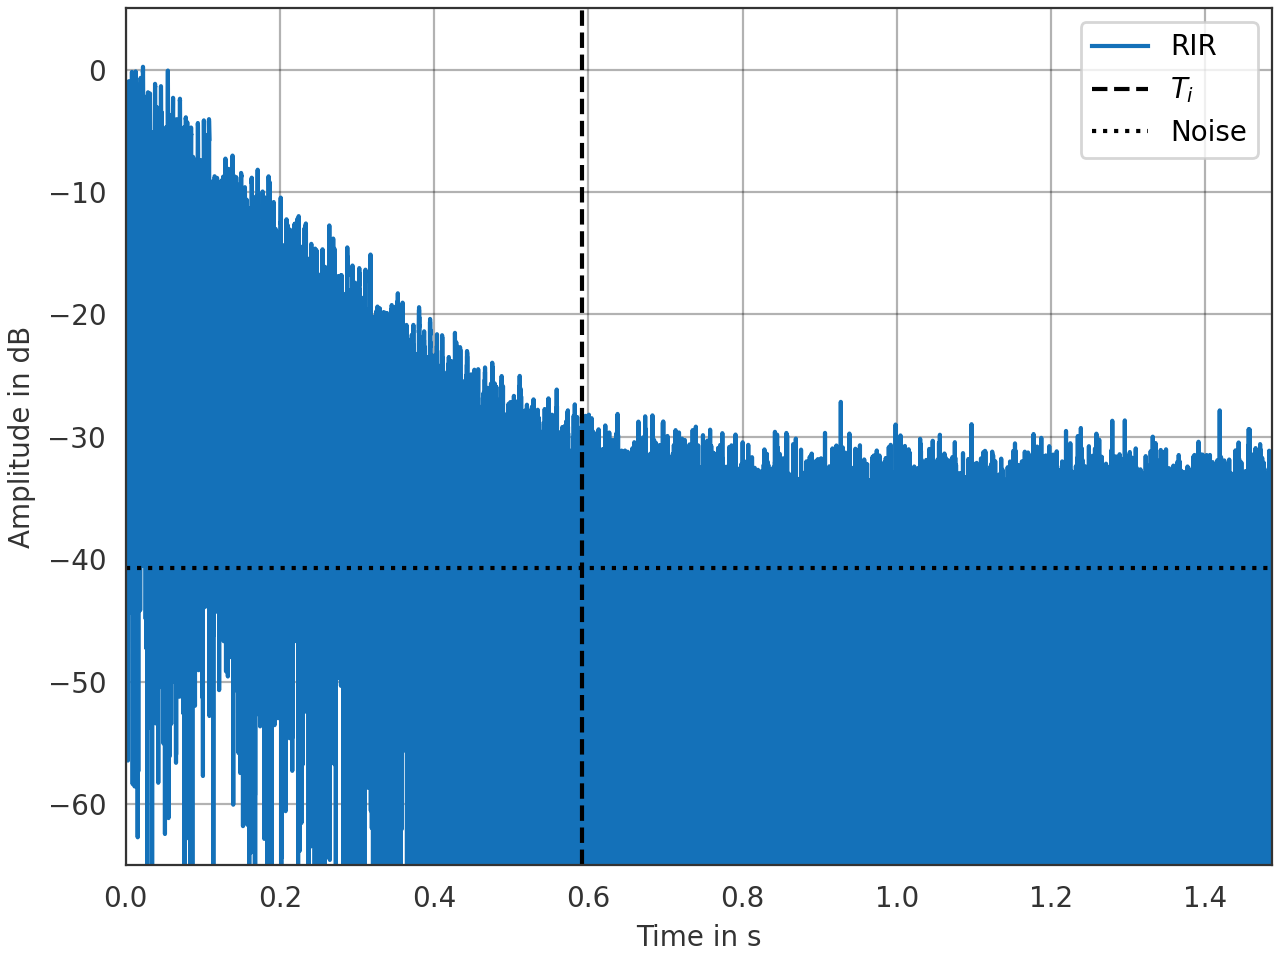
Estimate the intersection time \(T_i\) and plot the RIR and the estimated noise power.
>>> import numpy as np
>>> import pyfar as pf
>>> import pyrato as ra
>>> from pyrato.analytic import rectangular_room_rigid_walls
...
>>> L = np.array([8, 5, 3])/10
>>> source_pos = np.array([5, 3, 1.2])/10
>>> receiver_pos = np.array([1, 1, 1.2])/10
>>> rir, _ = rectangular_room_rigid_walls(
...     L, source_pos, receiver_pos,
...     reverberation_time=1, max_freq=1e3, n_samples=2**16,
...     speed_of_sound=343.9)
>>> rir = rir/np.abs(rir.time).max()
...
>>> awgn = pf.signals.noise(
...     rir.n_samples, rms=rir.time.max()*10**(-40/20),
...     sampling_rate=rir.sampling_rate)
>>> rir = rir + awgn
>>> inter_time, _, noise_power = ra.edc.intersection_time_lundeby(rir)
...
>>> ax = pf.plot.time(rir, dB=True, label='RIR')
>>> ax.axvline(inter_time, c='k', linestyle='--', label='$T_i$')
>>> ax.axhline(
...     10*np.log10(noise_power), c='k', linestyle=':', label='Noise')
>>> ax.set_ylim(-65, 5)
>>> ax.legend()
(
Source code,png,hires.png,pdf)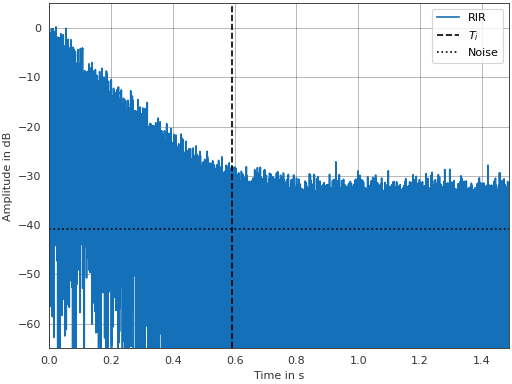
- pyrato.edc.schroeder_integration(room_impulse_response, is_energy=False)[source]#
Calculate the Schroeder integral of a room impulse response.
The result is the energy decay curve for the given room impulse response after [6].
\[\langle e^2(t) \rangle = \int_{t}^{\infty} h^2(\tau) \mathrm{d} \tau\]- Parameters:
room_impulse_response (pyfar.Signal, pyfar.TimeData) – The room impulse response.
is_energy (boolean, optional) – Whether the input represents energy data or sound pressure values. By default, this is set to
False. If set toTrue, the variable \(h(\tau)\) is assumed to represent energy and the power two is omitted from the given equation.
- Returns:
energy_decay_curve – The energy decay curve
- Return type:
References
Notes
No preprocessing of the impulse response is performed. In particular, this function does not:
detect or align the direct sound (impulse response start),
compensate for measurement noise,
truncate the impulse response at the noise floor.
The full length of the input signal is squared and integrated.
For measurements in accordance with ISO 3382 [7], appropriate preprocessing (
pyrato.edc.energy_decay_curve_truncation) of the impulse response (time alignment, band-pass filtering, and noise handling) must be performed before calling this function.Example
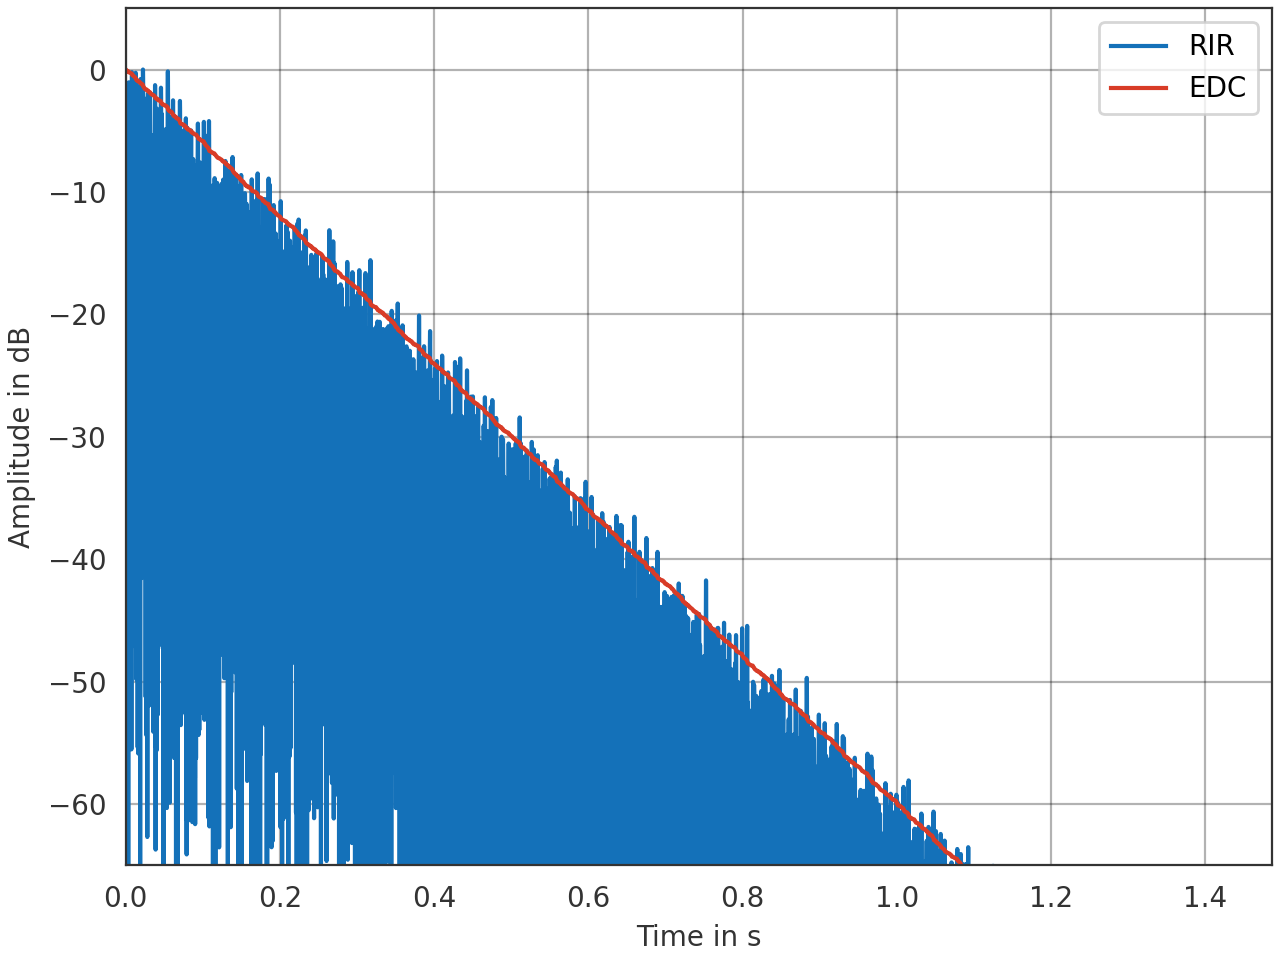
Calculate the Schroeder integral of a simulated RIR and plot.
>>> import numpy as np
>>> import pyfar as pf
>>> import pyrato as ra
>>> from pyrato.analytic import rectangular_room_rigid_walls
...
>>> L = np.array([8, 5, 3])/10
>>> source_pos = np.array([5, 3, 1.2])/10
>>> receiver_pos = np.array([1, 1, 1.2])/10
>>> rir, _ = rectangular_room_rigid_walls(
...     L, source_pos, receiver_pos,
...     reverberation_time=1, max_freq=1e3, n_samples=2**16,
...     speed_of_sound=343.9)
>>> edc = ra.edc.schroeder_integration(rir)
>>> pf.plot.time(rir/np.abs(rir.time).max(), dB=True, label='RIR')
>>> ax = pf.plot.time(
...     edc/edc.time[..., 0], dB=True, log_prefix=10, label='EDC')
>>> ax.set_ylim(-65, 5)
>>> ax.legend()
(
Source code,png,hires.png,pdf)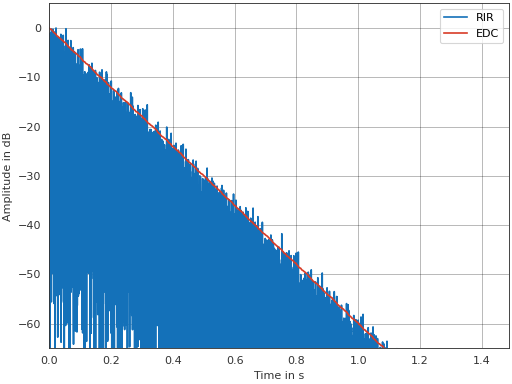
- pyrato.edc.subtract_noise_from_squared_rir(data, noise_level='auto')[source]#
Subtract the noise power from a squared room impulse response.
- Parameters:
data (pyfar.TimeData) – The squared room impulse response.
noise_level (str or numpy.ndarray, float, optional) – The noise power for each channel. The default is ‘auto’, which will try to estimate the noise power from the room impulse response.
- Returns:
The squared room impulse response after noise power subtraction.
- Return type:
- pyrato.edc.threshold_energy_decay_curve(energy_decay_curve, threshold)[source]#
Threshold an energy decay curve.
- Parameters:
energy_decay_curve (pyfar.TimeData) – The energy decay curve
threshold (float) – The threshold level in dB. The data below the threshold level are set to
numpy.nanvalues.
- Returns:
energy_decay_curve – The thresholded energy decay curve
- Return type: